Mis DashBoards
Discovering My Dashboards
Step 1: While on the Home screen, select the My Dashboards option.
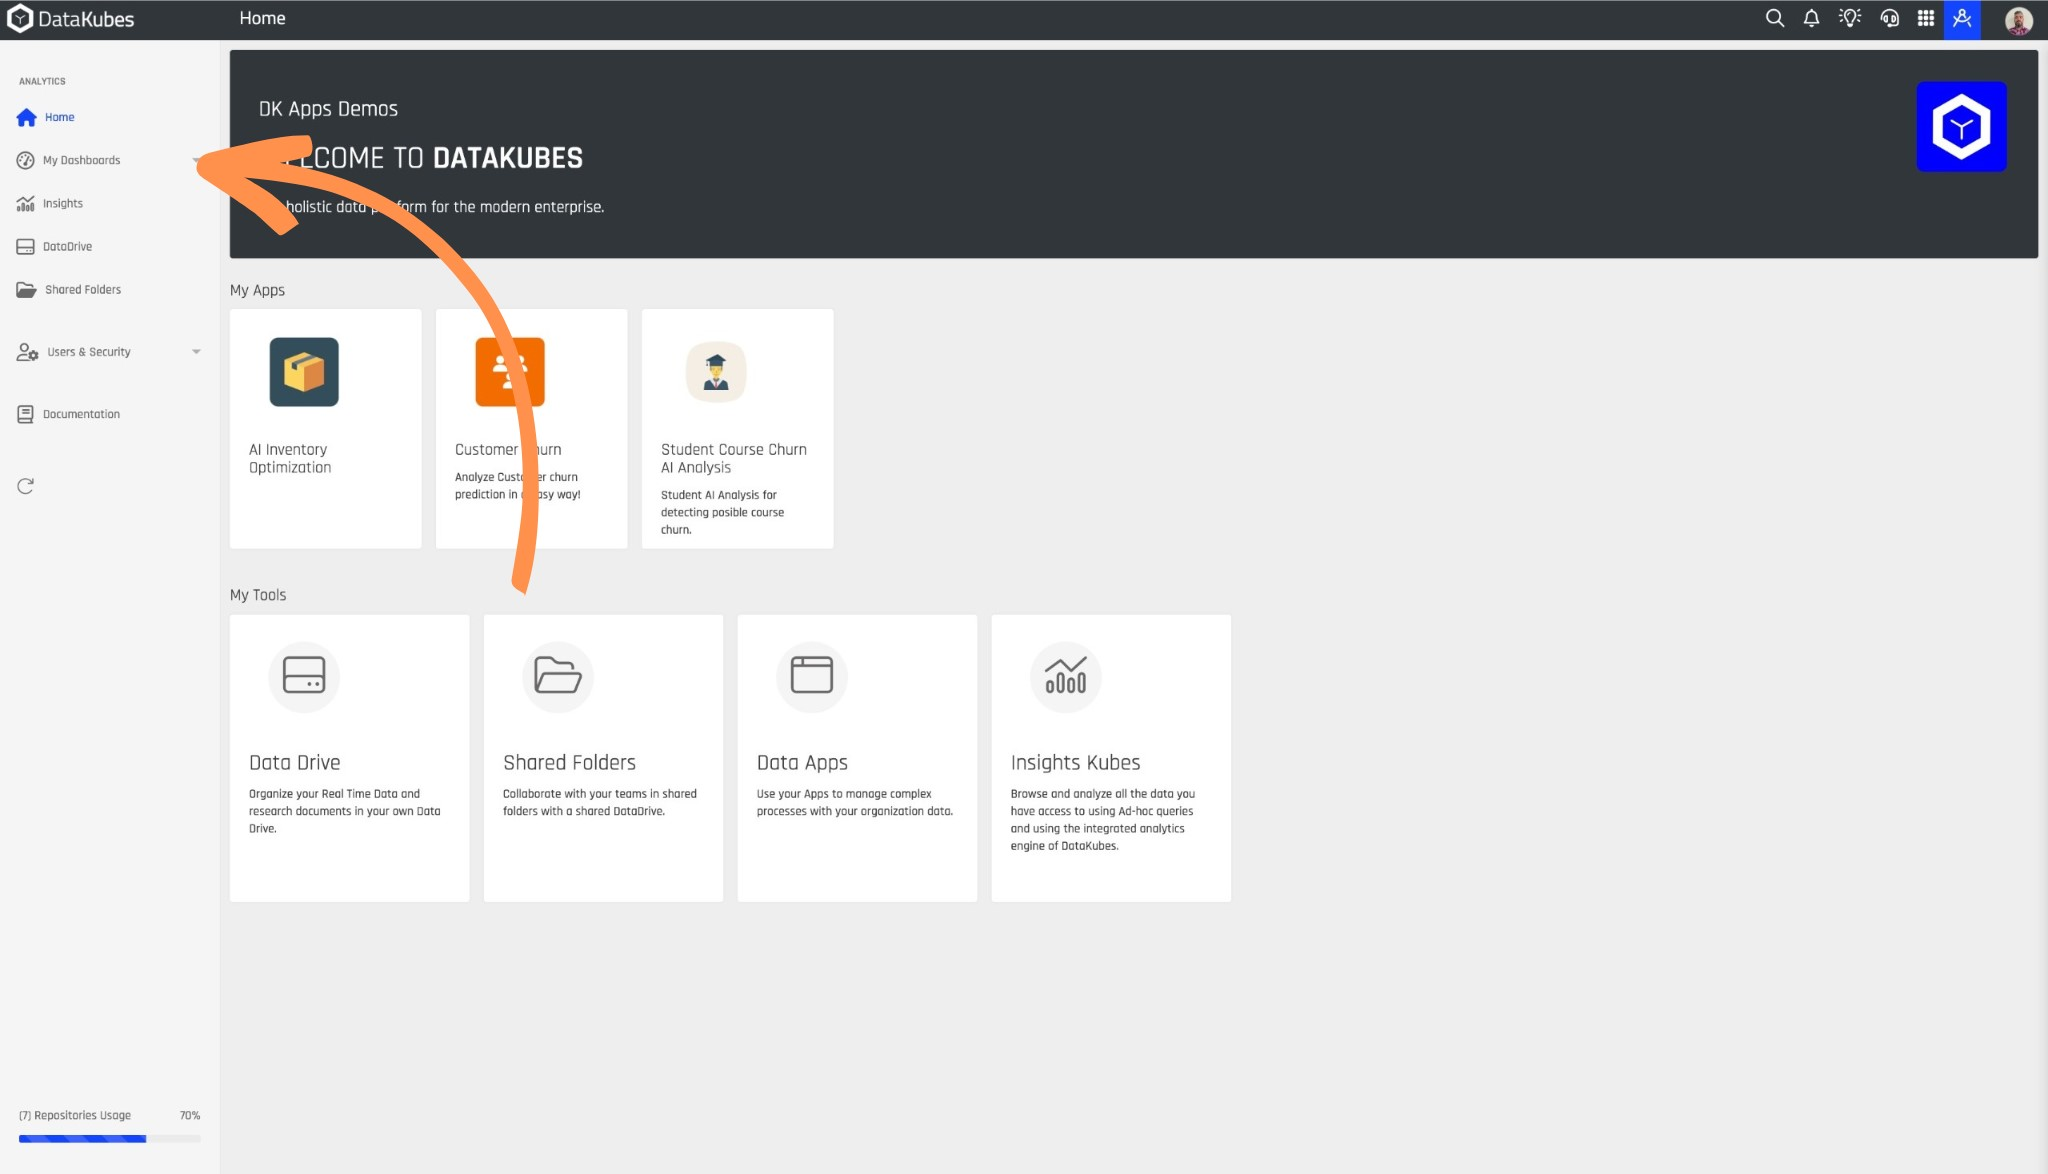
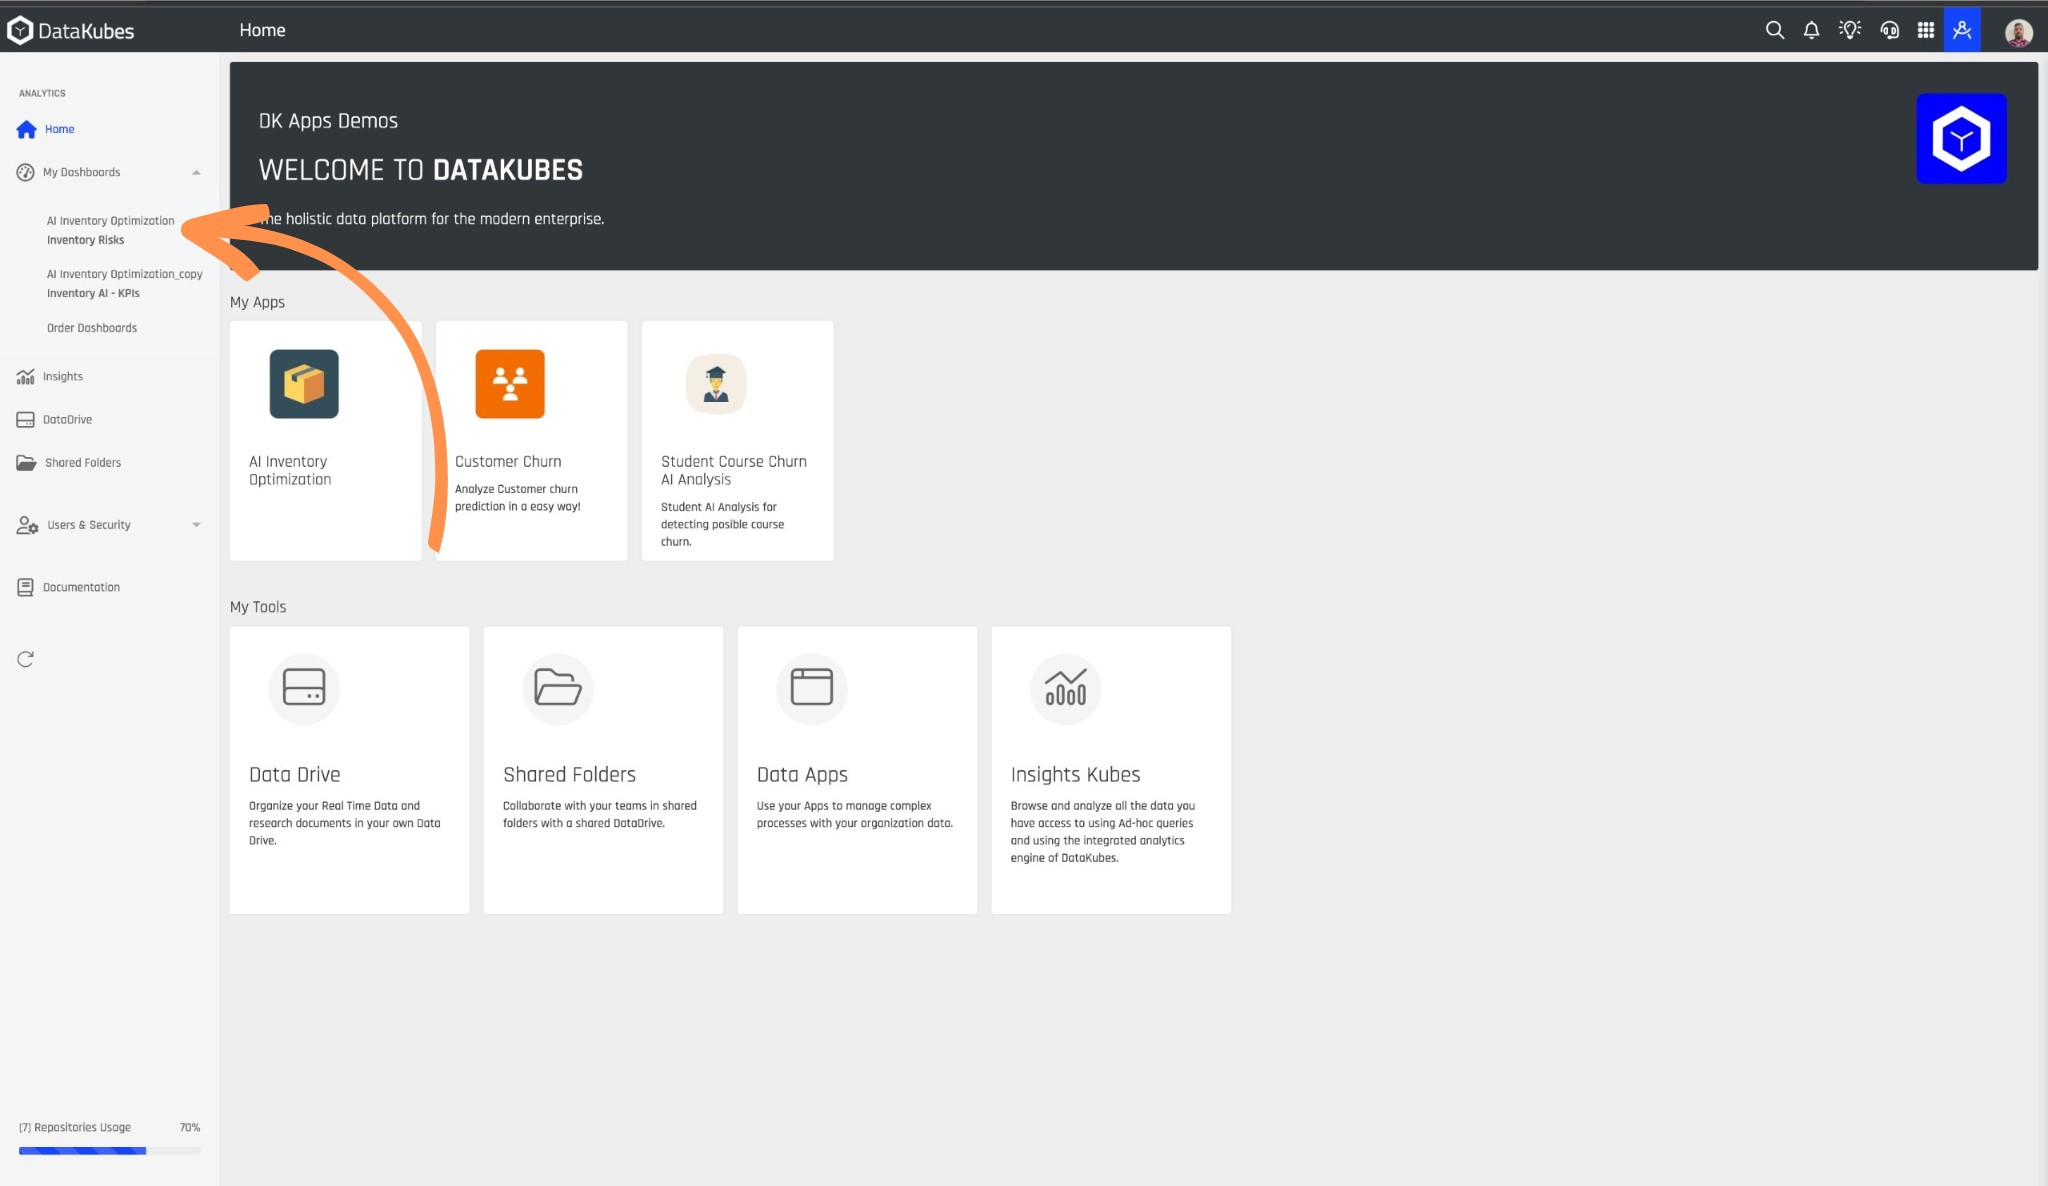
Step 2: Choose the dashboard you desire.
Necessary Permissions
To be able to view dashboards in My Dashboards, you need to grant access to them. For this, refer to the documentation on User Access Settings.
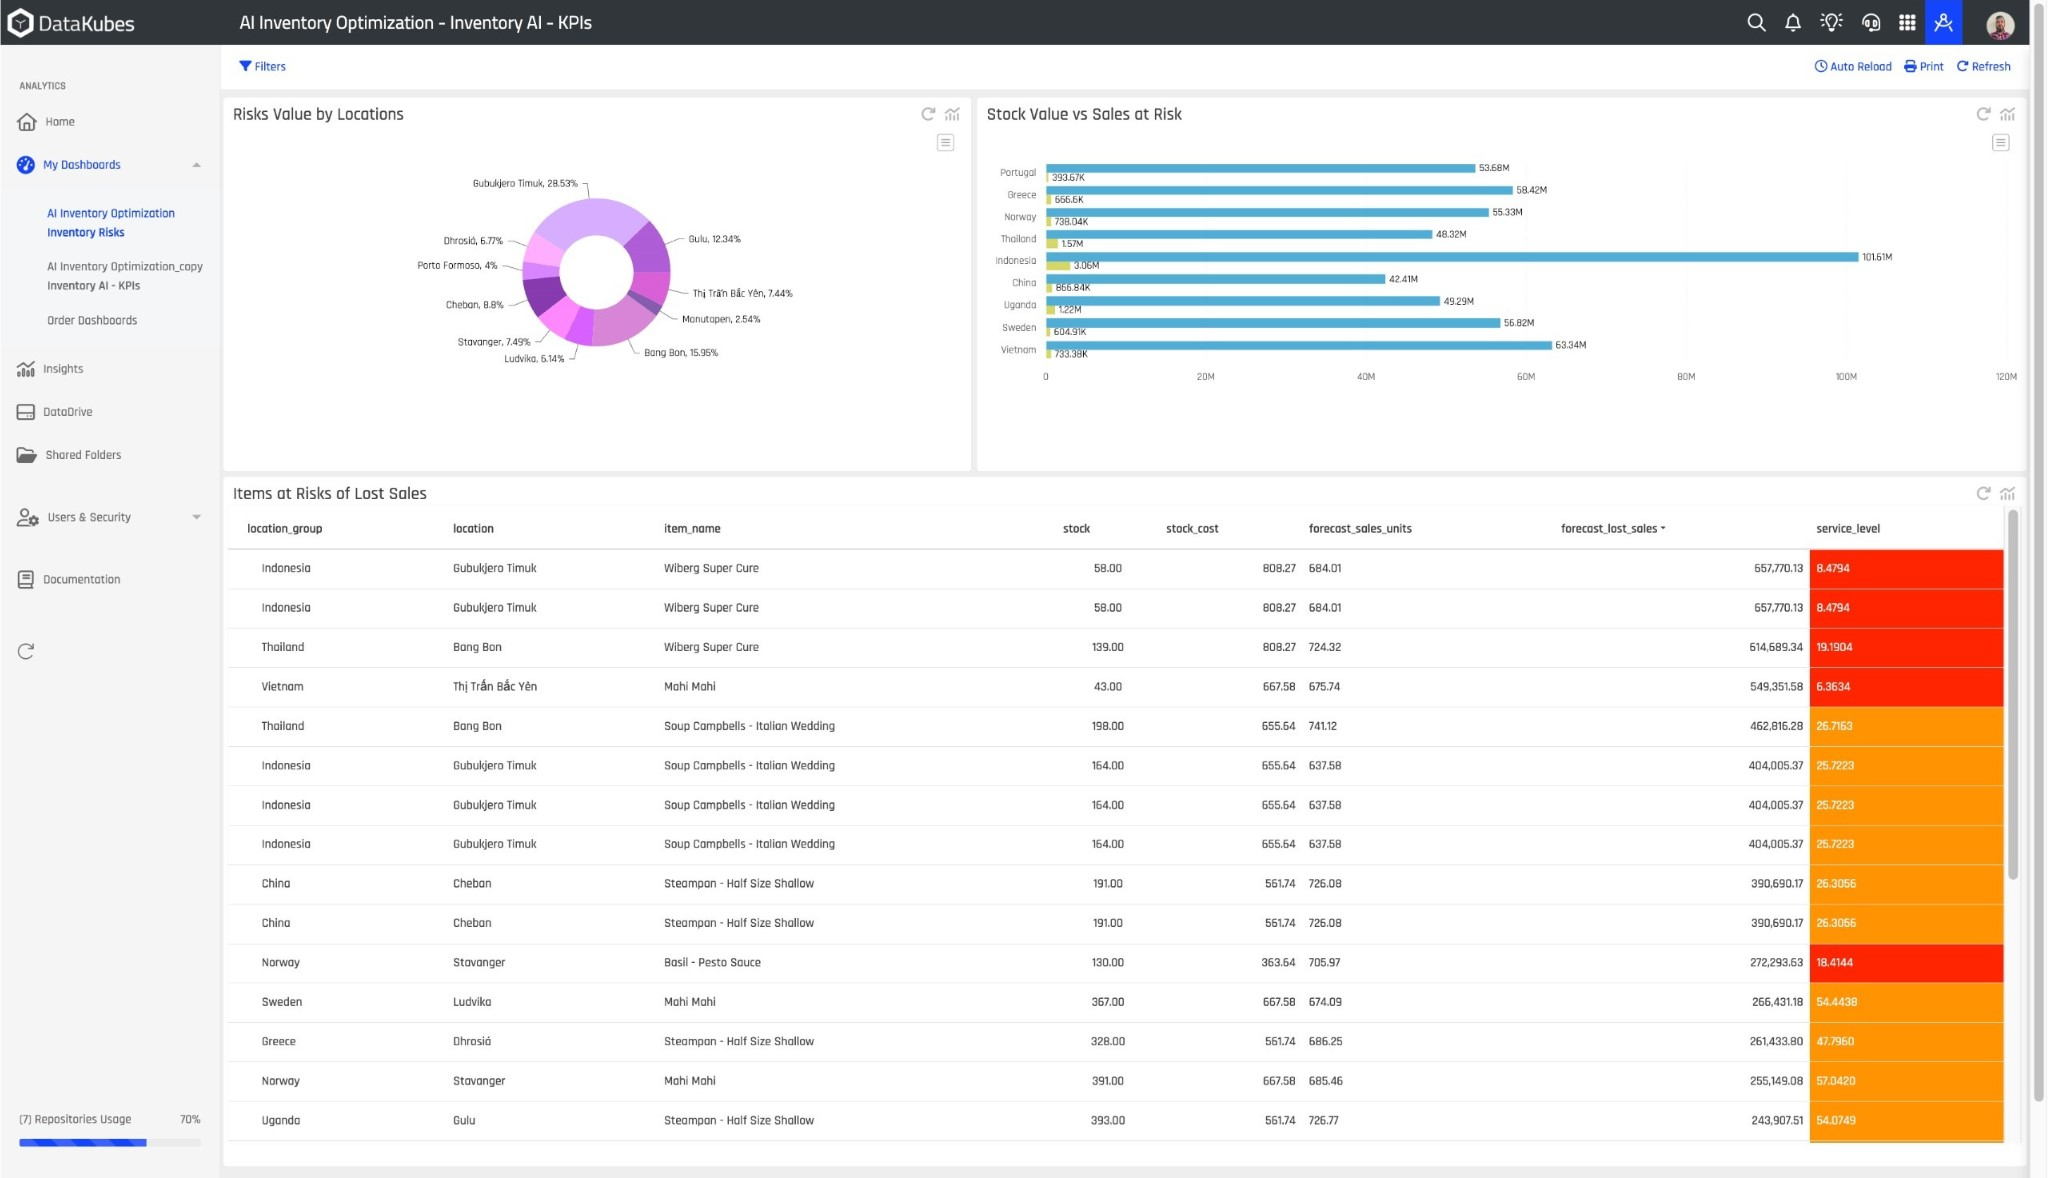
Step 3: After selecting our Dashboard, we can observe the data represented in different forms such as various types of charts or tables.
Important
Dashboards can be multiple, assigned per user, they can contain filters, and date range filters to segment the analysis spectrum.
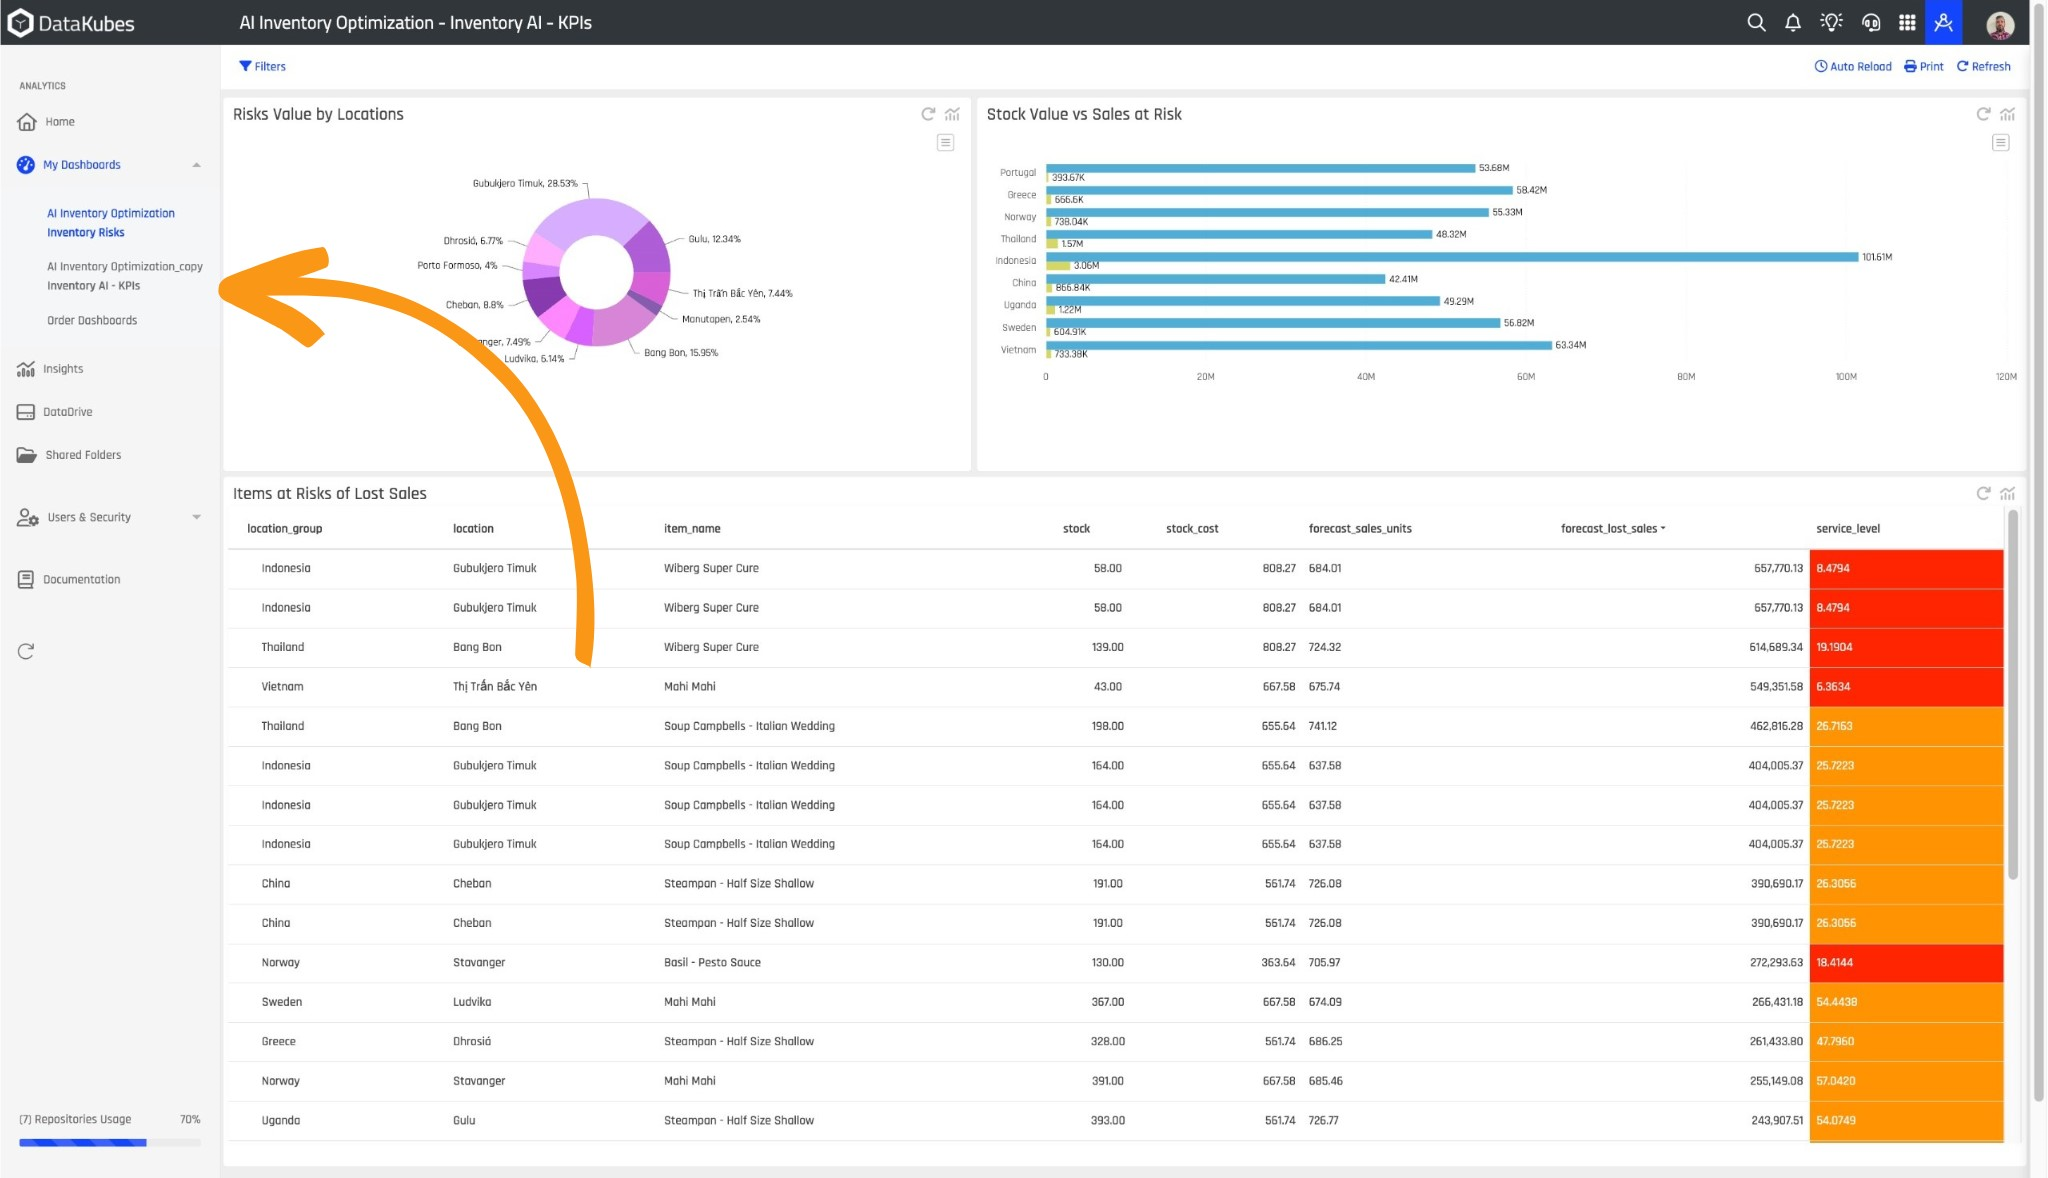
Step 4: We can also switch between dashboards in our list.
Dashboard Creation
To create dashboards, you must be an administrator user.
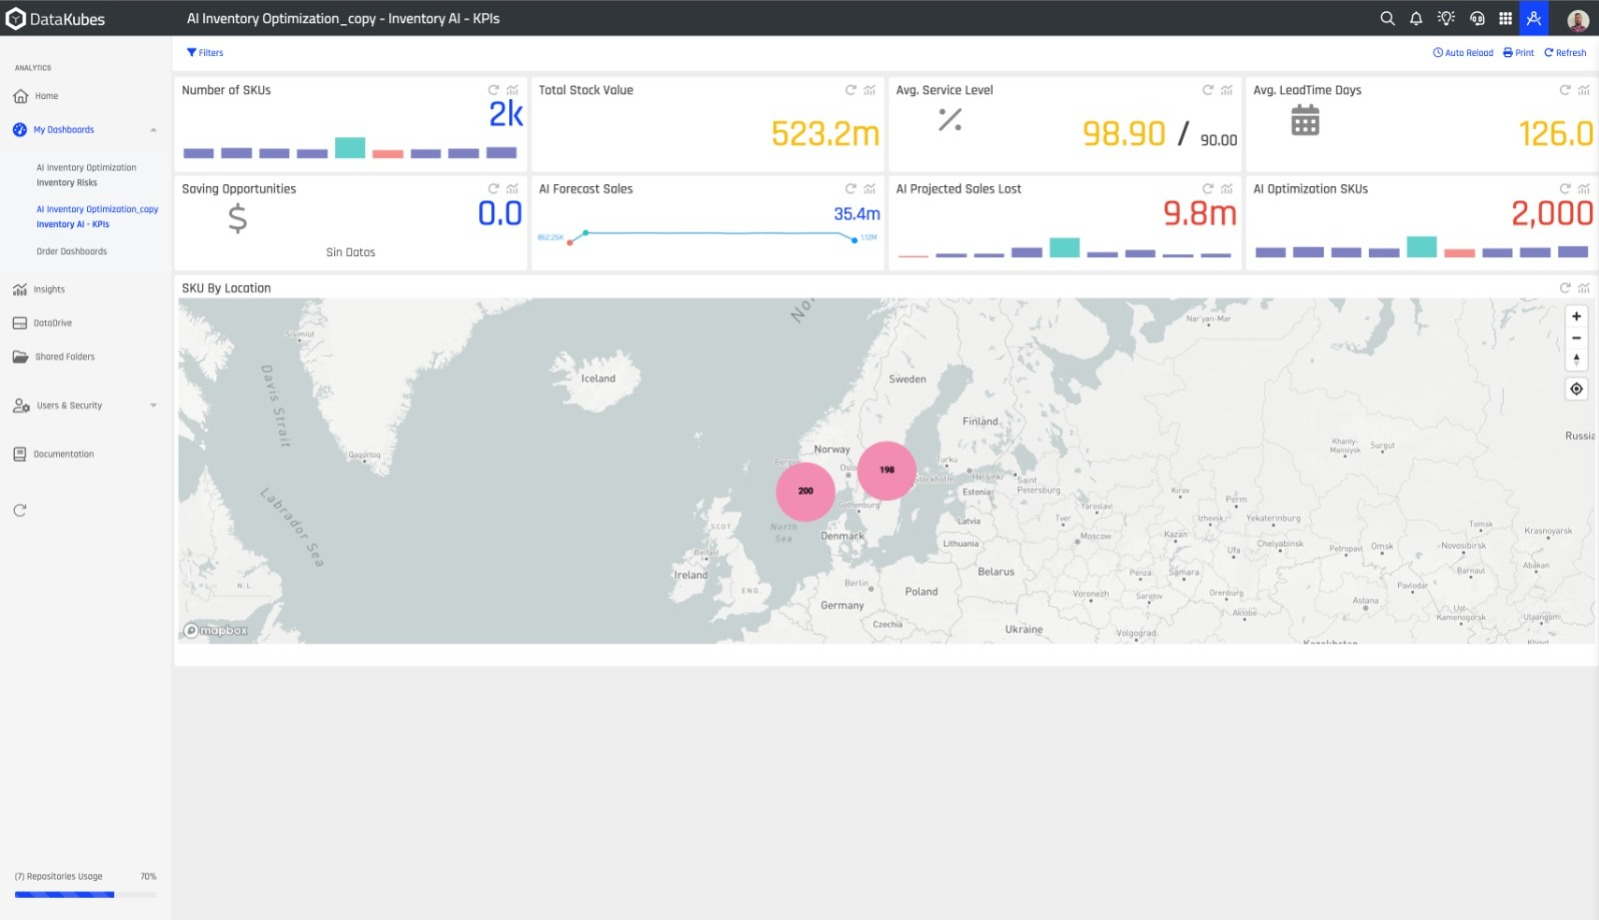
Step 5: In Dashboards, you can also view information on maps.
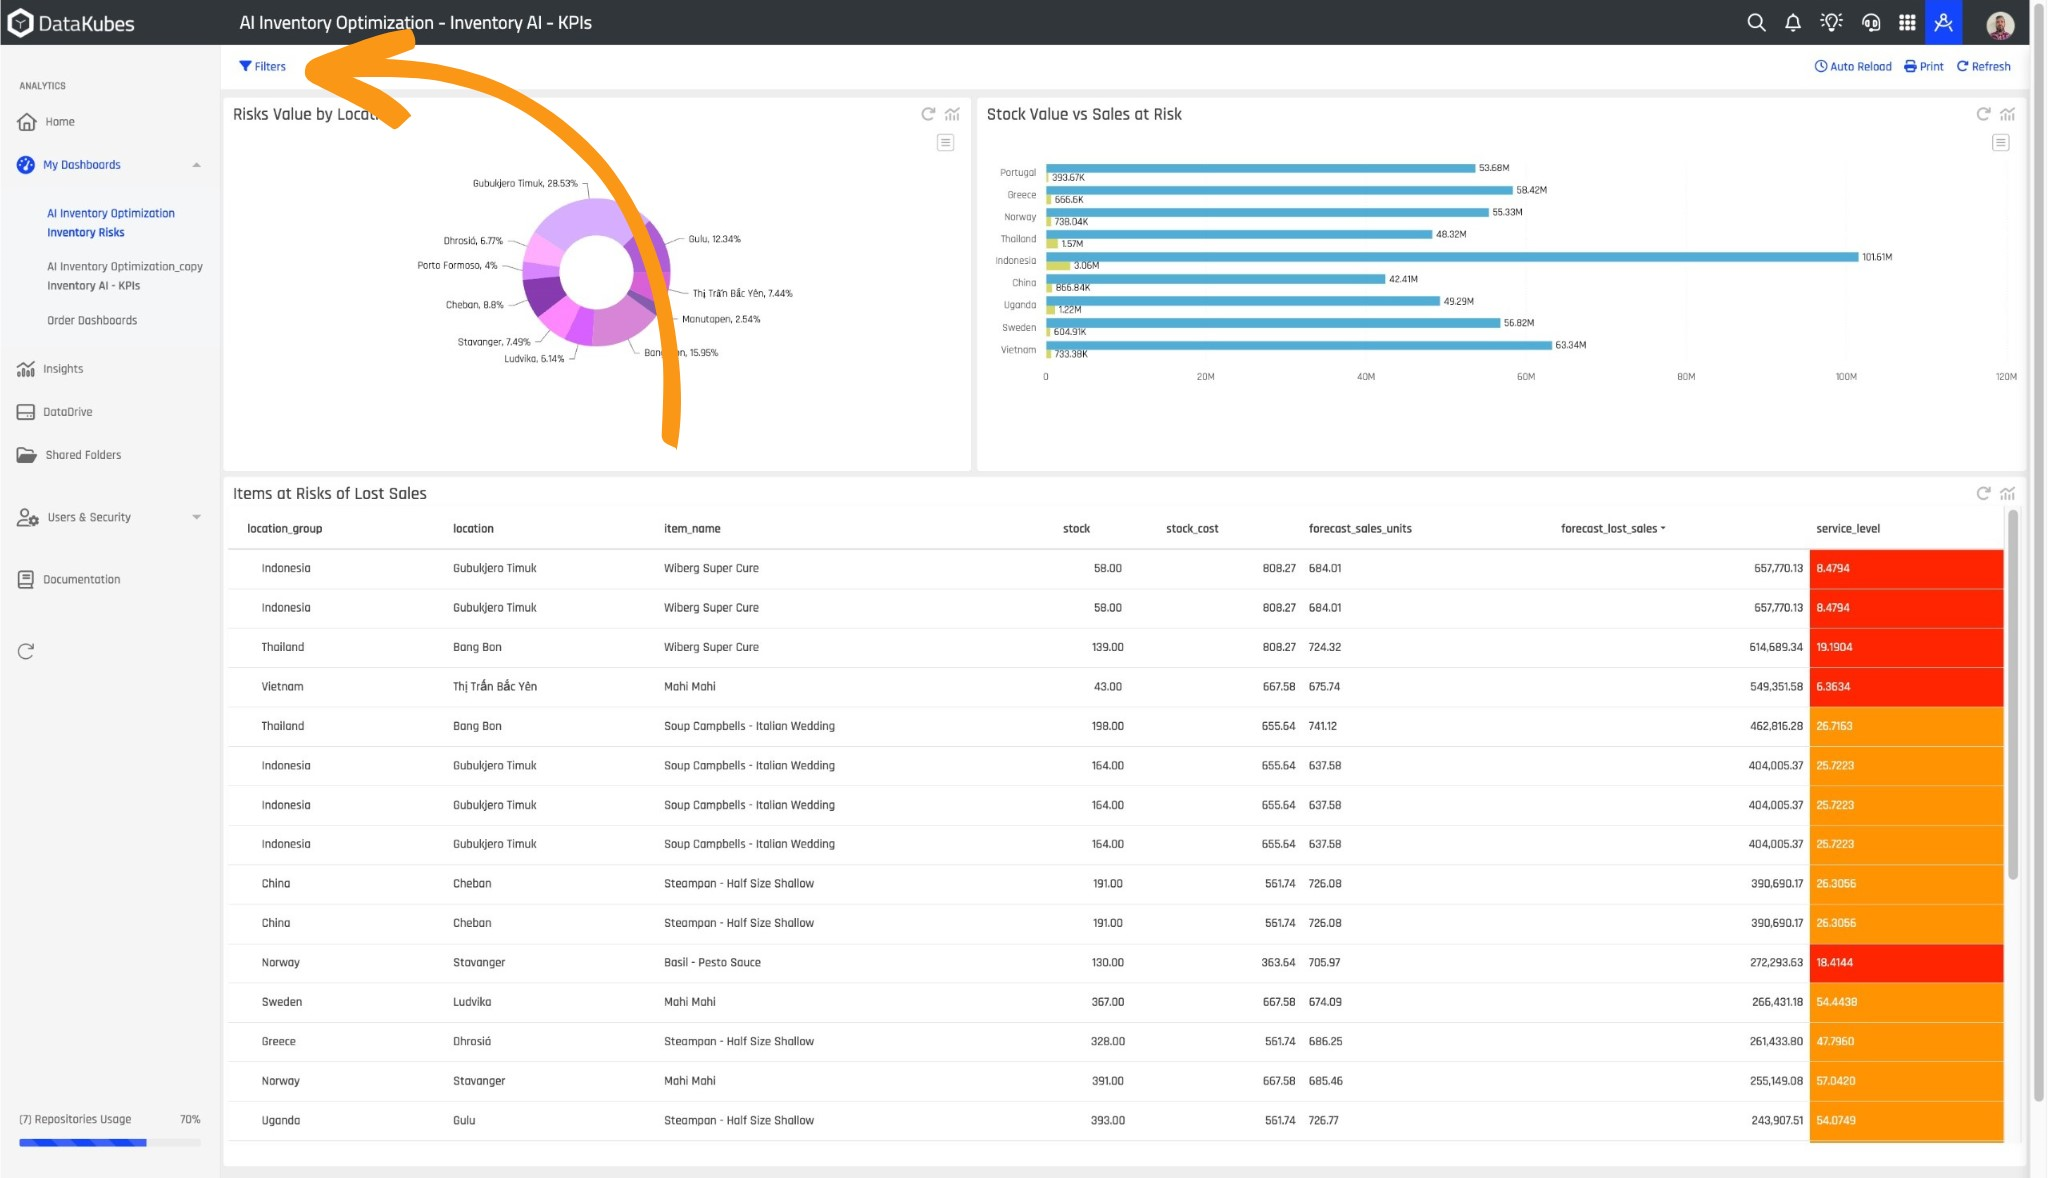
Step 6: Some Dashboards are configured with filters, which you can select by clicking on Filters.
Step 7: From your Dashboard, you can observe information about the Kubes. To do this, click on the Insights icon to access it quickly.
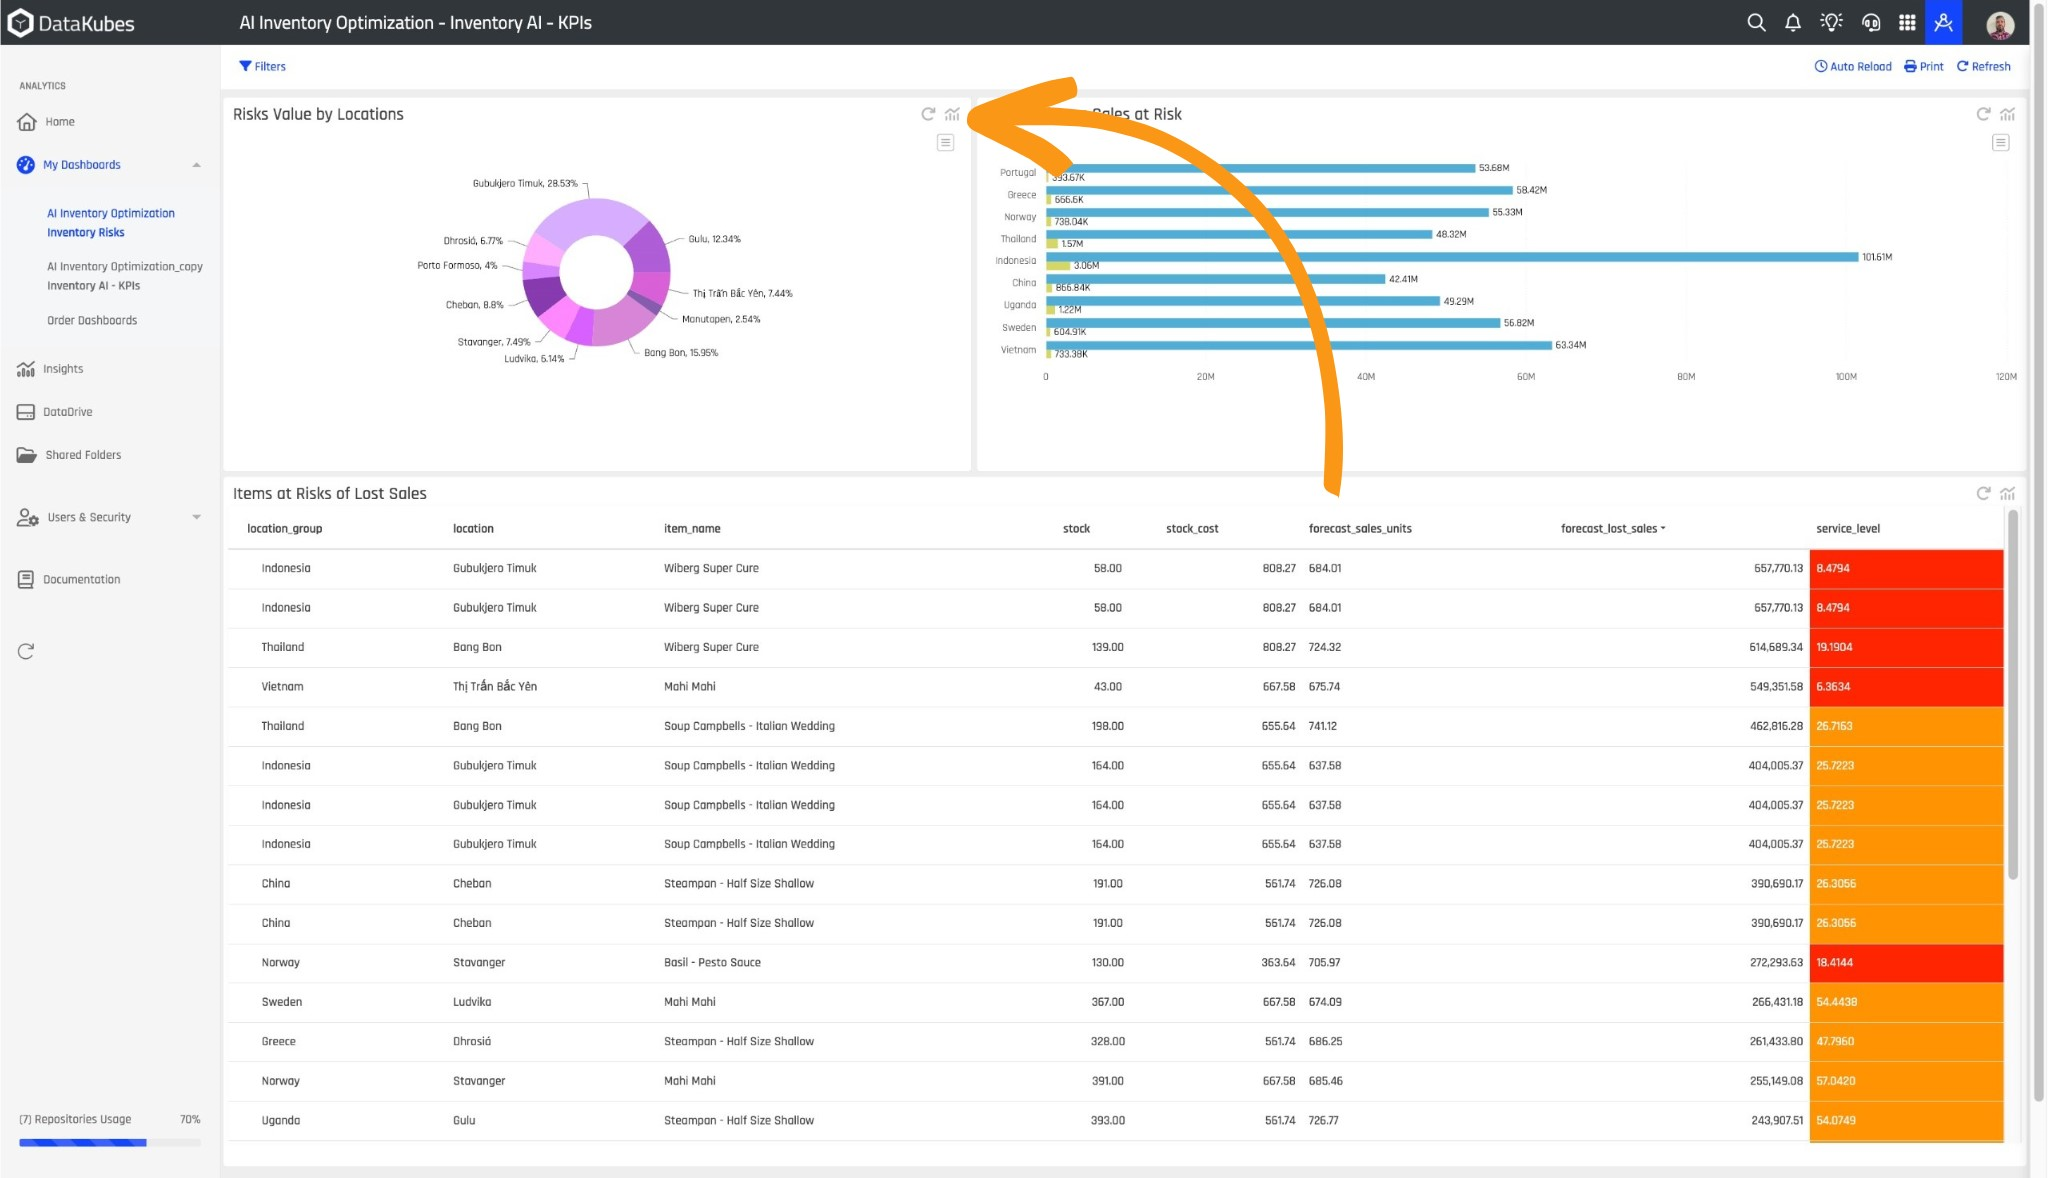
In the following image, you can observe the Insights icon.

Insights Icon on each Kube of the Dashboard.
Viewing Insights
The Insights icon can only be viewed from within ARPIA and not as an external published application.
If you want to learn more about creating Dashboards, you can refer to the Dashboard Creation documentation.
Updated about 1 month ago